Debugging PHP on MacOS with XDebug, Visual Studio Code and MAMP Pro
This is a tutorial on how to use Visual Studio Code, XDebug and MAMP Pro to debug PHP code live during runtime. Similar to Javascript and C# debugging, this combination gives PHP developers the ability to toggle break points and add “Watched Variables”’ to a monitored group, or to see variable changes live during program execution. It also removes the need to use print_r() or var_dump() as a means of determining timing, pattern changes, variable assignment and declaration.
Use Cases
- General PHP Custom Applications
- WordPress Custom Theme Development
- WordPress Plugin Development PHP Rest Services
- cURL Operations
Prerequisites
- Homebrew
- PHP
- Xdebug
- Visual Studio Code
- MAMP Pro
- PHP Debug Extension for Visual Studio Code
Optional
- PHP Server Extension for Visual Studio Code
- PHP IntelliSense Extension for Visual Studio Code
First Time Installation and Setup for all sites.
Homebrew, Xdebug & PHP (First time only, for all sites)
- Open Terminal
- Install Homebrew using Terminal/CLI.
sudo /bin/bash -c "$(curl -fsSL https://raw.githubusercontent.com/Homebrew/install/HEAD/install.sh)"- Install PHP using Terminal/CLI.
brew install php- Install Xdebug with PECL using Terminal/CLI.
- MacOS with ARM Silicon
sudo arch -arm64 sudo pecl install xdebug- MacOS with AMD Silicon
sudo arch -x86_64 sudo pecl install xdebug- Verify that PHP is installed using Terminal/CLI.
php -v- Locate php.ini and append Xdebug configuration.
php --ini- Open the file listed as “Loaded Configuration File” in the output that was given to you by the previous command.
- Open php.ini in your favorite editor and append the following configuration to the bottom of the php.ini file. (It may already be there, but if not, or if you are confused, you can add it again and the bottom of the file and these lines will override any lines above it).
[xdebug]
zend_extension="xdebug.so"
xdebug.mode=debug
Install & Configure MAMP Pro (First time only, for all sites)
- Get license key from Integrity Team Password for MAMP Pro.
- Download MAMP Pro from here .
- Install MAMP Pro.
- Open MAMP Pro, and change the view to “Expert Mode” in the top left corner.
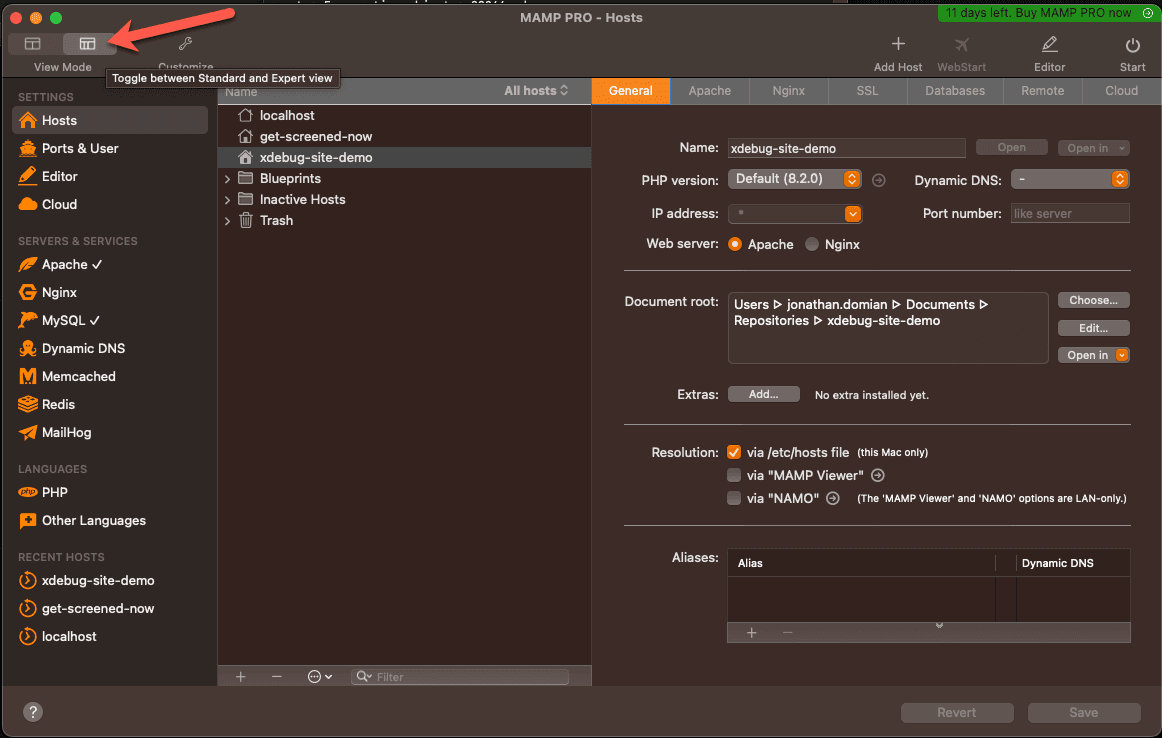
- In MAMP Pro, in the left navigation bar, click on “PHP” under “Languages”. Towards the top, you will see the version of PHP selected via a dropdown. Next to the dropdown you will see an “Open Template” button. Click this to open the php.ini file. (A warning will pop up, click “Open”.) We can edit this later here for next steps, or you can use a local file path.
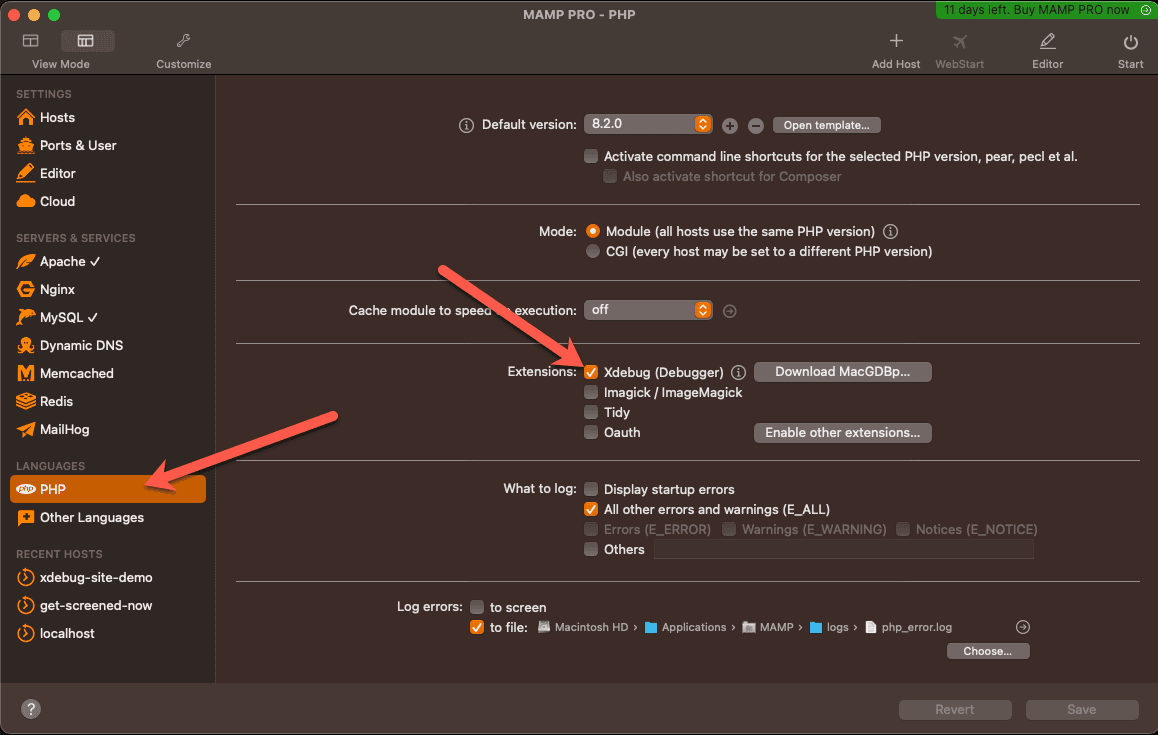
- In MAMP Pro, in the left navigation bar, click on “PHP” if it’s not already open from the previous step. Towards the center of the PHP screen, find “Xdebug (Debugger)” and check the box next to it. Click the “Save” button and the PHP server will restart.
Install & Configure Visual Studio Code (First time only, for all sites)
- Download & install Visual Studio Code from here .
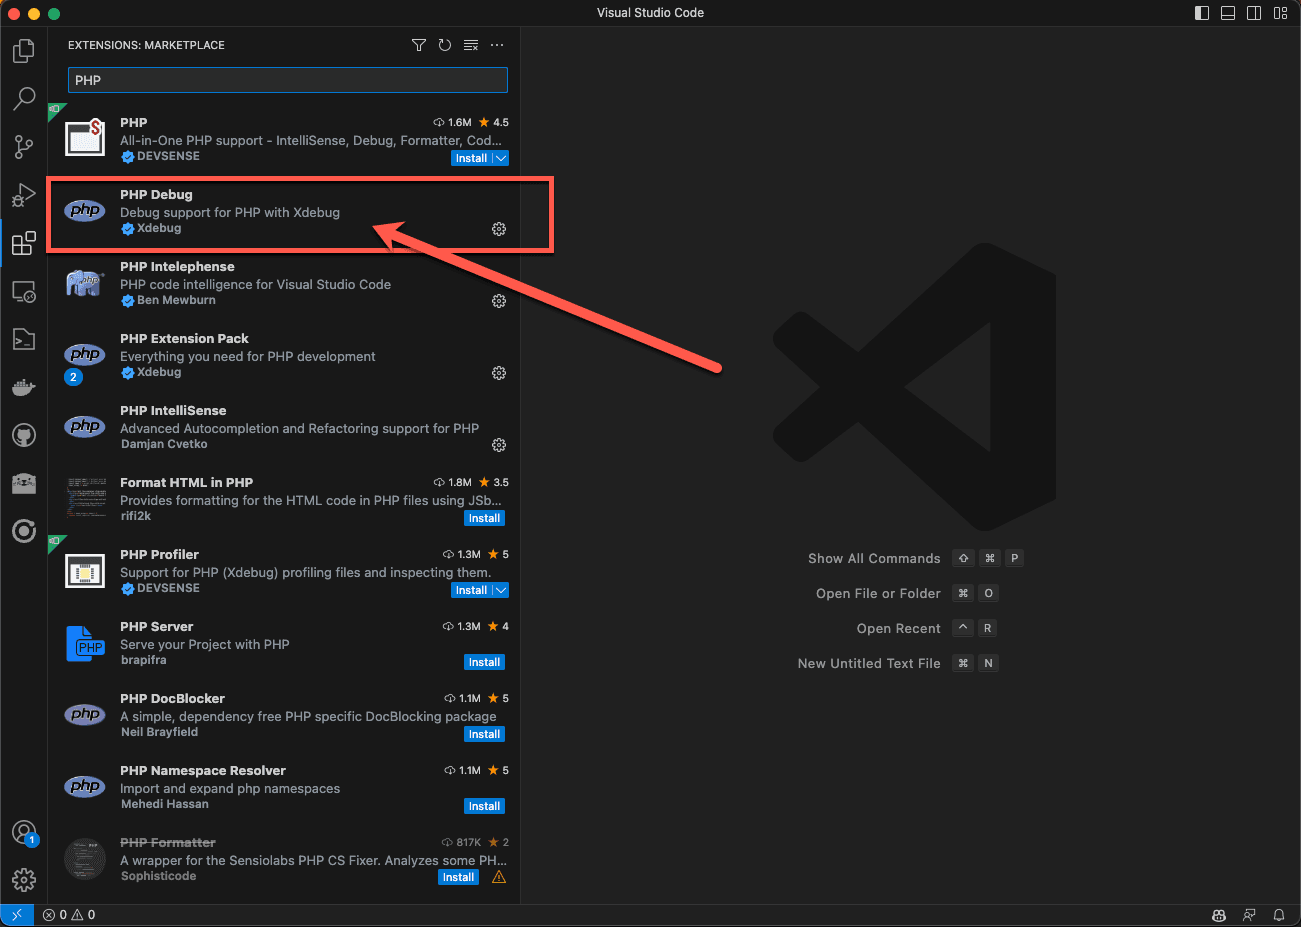
- Install PHP Debug extension for VSCode. You can search the Extensions list for “PHP Debug” by “Xdebug” or click here to go directly to the extension.
VSCode + MAMP Pro Debugging for PHP Projects/Repos
General PHP Debugging
- Create directory for a new project OR clone existing Integrity PHP repo into a new project directory. (For WordPress specific projects, see below)
- Open MAMP Pro
- Under the “Hosts” tab, click the ”+” button to add a new host. You can use an existing repo such as a WordPress or PHP repo.
- Add a host “Name” which will be the URL for the site. (ex: integrity.local). Then select the “Document Root” which will be the path to the project’s repo directory. (ex: /Users/username/Sites/integrity). Click “Continue” to create the host.
- Open up MAMP Pro again, and click on the host you just added. Then next to its name, you will see an “Open” button which will open your site/app in your default browser at the host’s name on port 8888. Example: http://mamp-host-name:8888 .
WordPress PHP Debugging
Setting up existing WordPress repository
These instructions are for setting up a new host for MAMP using an existing WordPress site with a repository. You should only need a new local site. This should only be required for the initial setup of a local site.
- Clone an existing Integrity WordPress repo into a new project directory. (The repo should only consist of /wp-content plugins, theme files and other Integrity specific custom client files… not core WP files.)
- Open MAMP Pro
- On the mail screen, hit the ”+” button in the bottom left to create a new site.
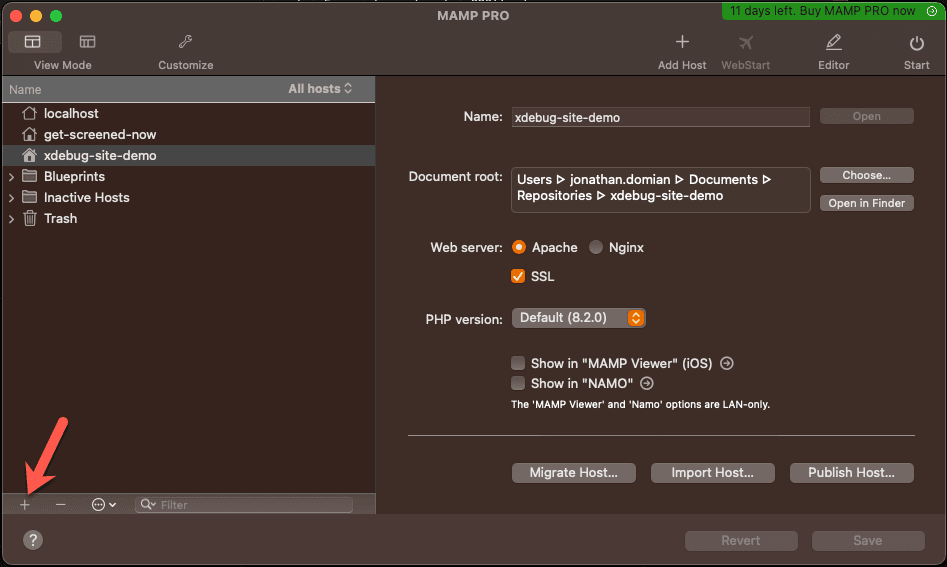
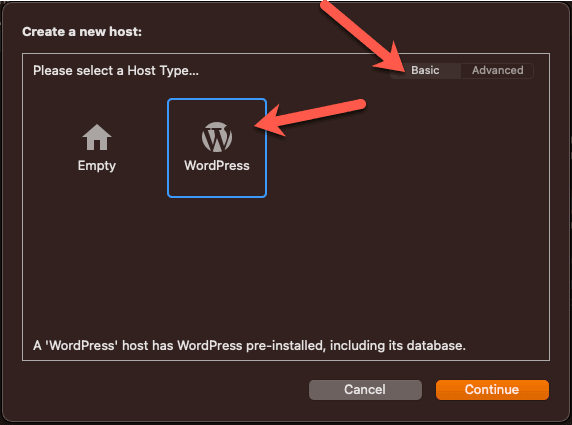
- On the next screen, click on the “WordPress” option under the “Basic” tab.
- On the next screen, add your own “Name” to the site (you should match the name of the repo if possible) which will be your local domain name, then select the WordPress repository root from the first step.

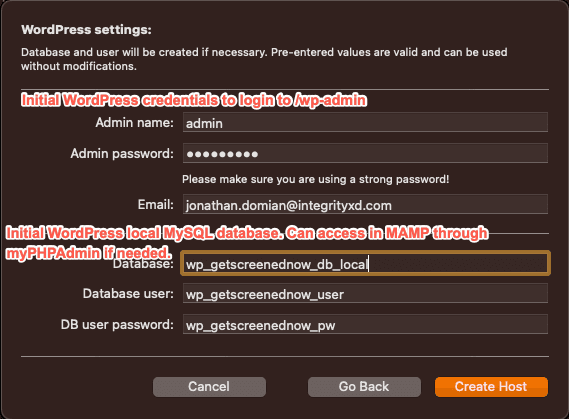
- Next, add a WordPress initial admin user credentials, and create an initial blank WordPress database. These credentials will be required to login to our initial dummy WordPress site using /wp-admin, then overwritten when we do a WordPress migration from staging/QA/Prod to our local machine.
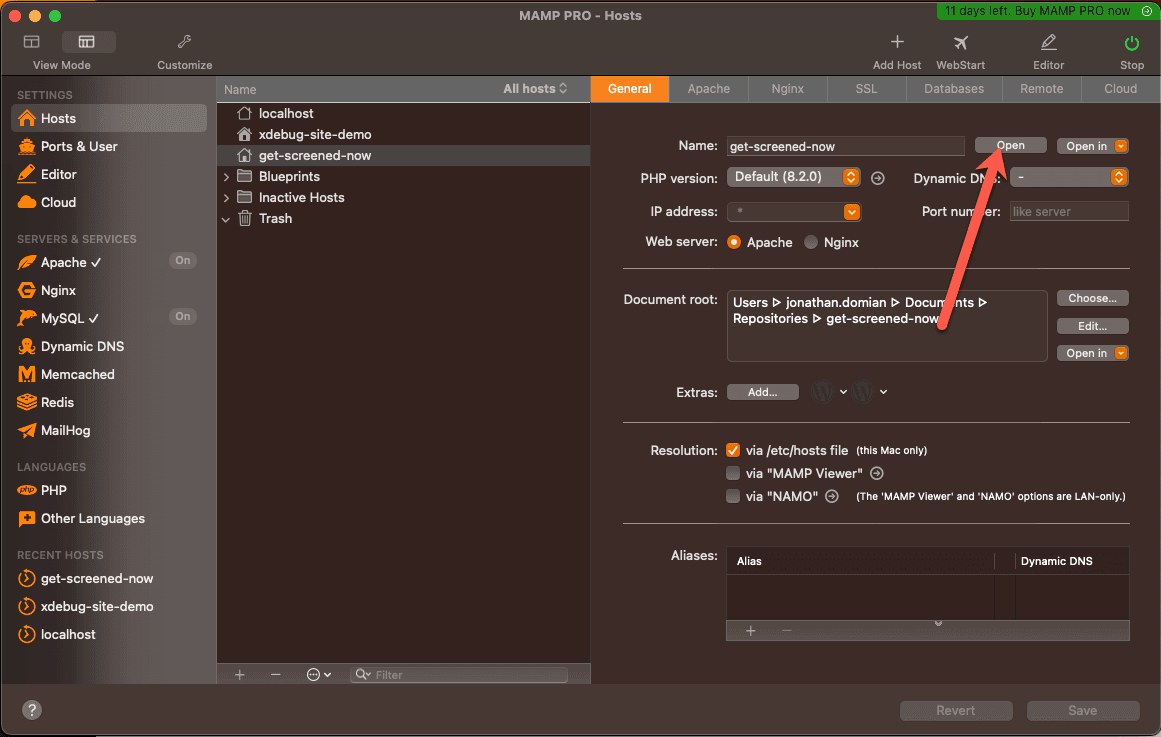
- Restart MAMP Server, then click on “Open” next to your new site.
- From here, your browser will open the site at port 8888.
Setup VSCode to debug a MAMP Pro hosted site.
Once you have your new local MAMP site setup, use the following to set up VSCode to debug it. You should only have to do this once.
- Open VSCode
- Open the folder where you clone your repo and create the MAMP WordPress site in the previous steps.
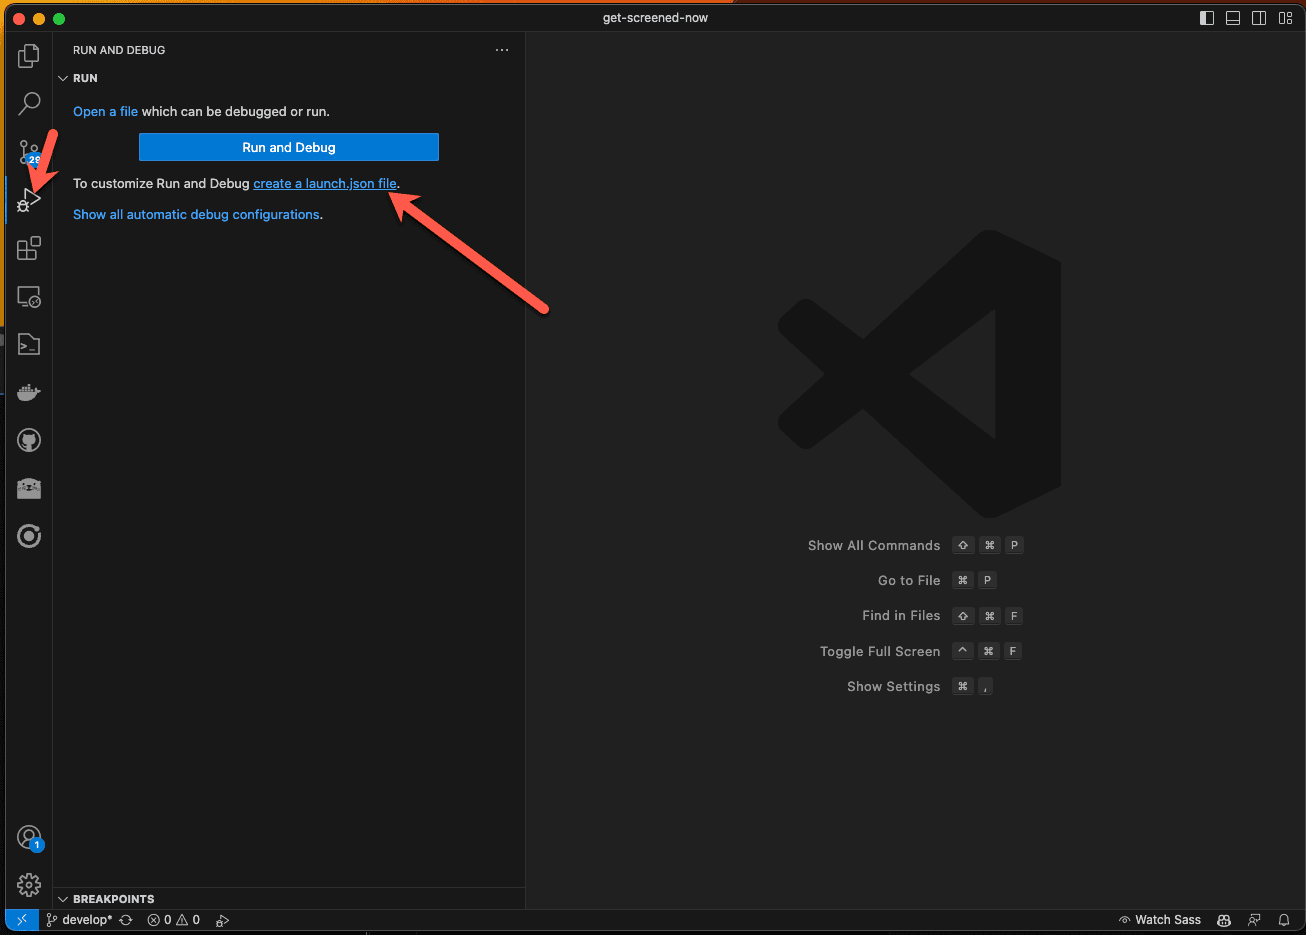
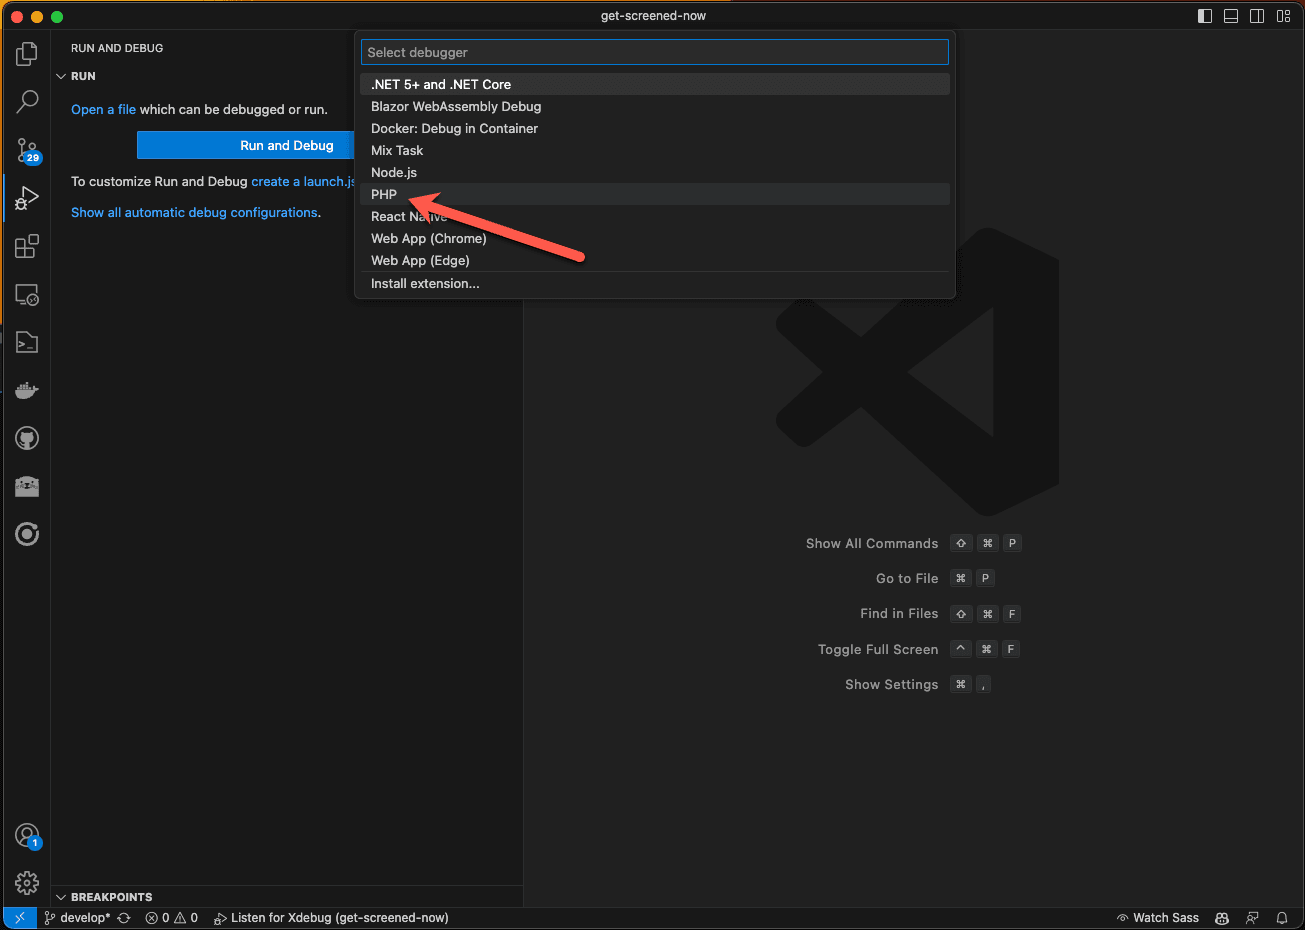
- Click on the “Run and Debug” item in the left nav. Then click the “create a launch.json file” link. This will create the default options as a .json file for debugging with XDebug.
- This will open the center dropdown, select “PHP” from the options.
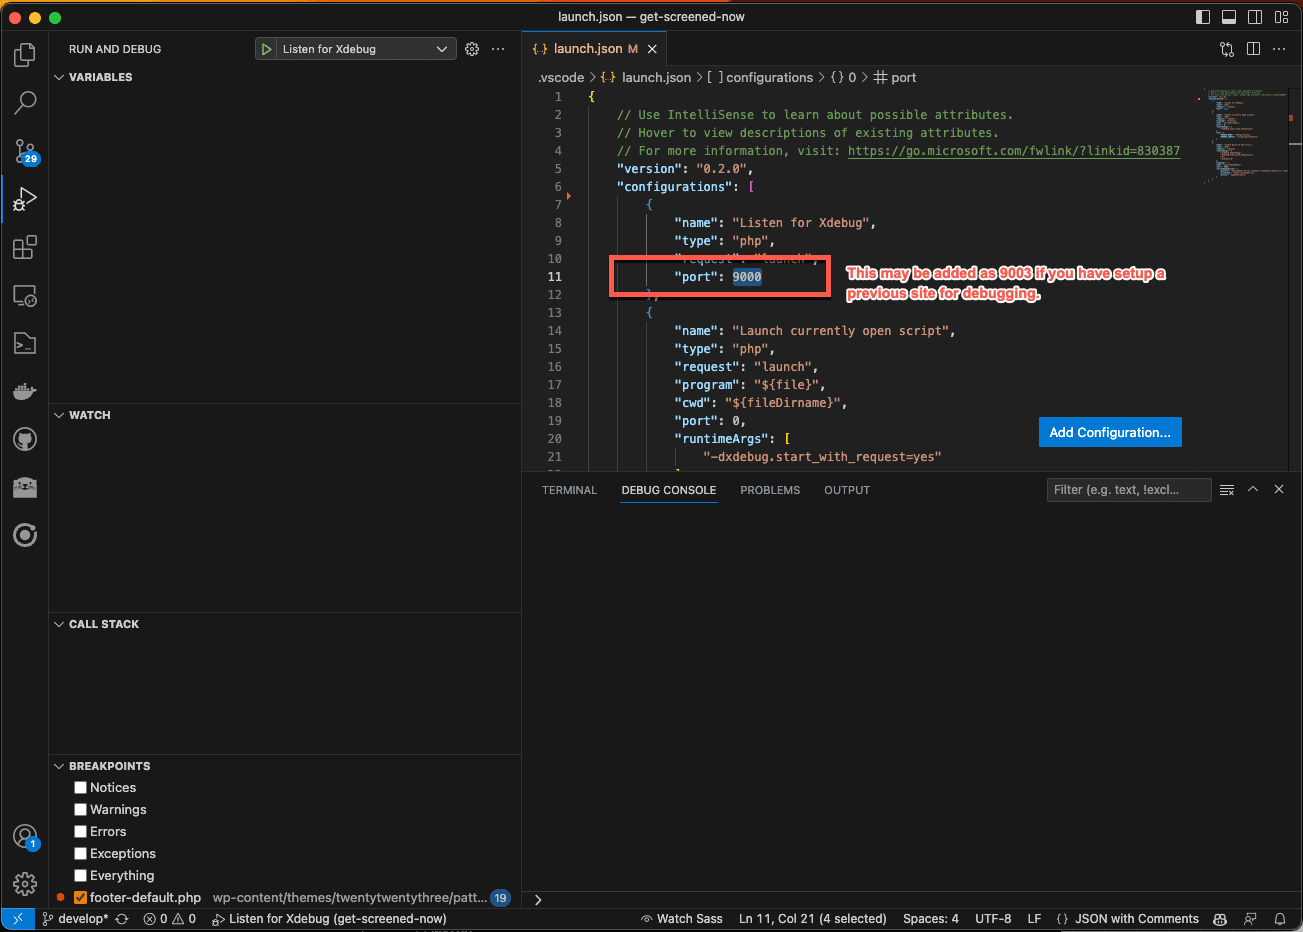
- This will automatically output the launch.json files into the root directory. The location of this file should be located at /(directory_root)/.vscode/launch.json. Take note of this incase you need to debug or make tweaks to the configuration later.

- Note: The default port that XDebug uses with MAMP Pro is 9000. Change this port number to 9000 in the launch.json if debugging does not initially hit breakpoints.
Start Debugging
Assuming you have all the previous steps setup and configured and you have added the “launch.json” .vscode file to your repo through VSCode, do the following to start your debugging session.
- Be sure you have the folder for your repo opened in VSCode.
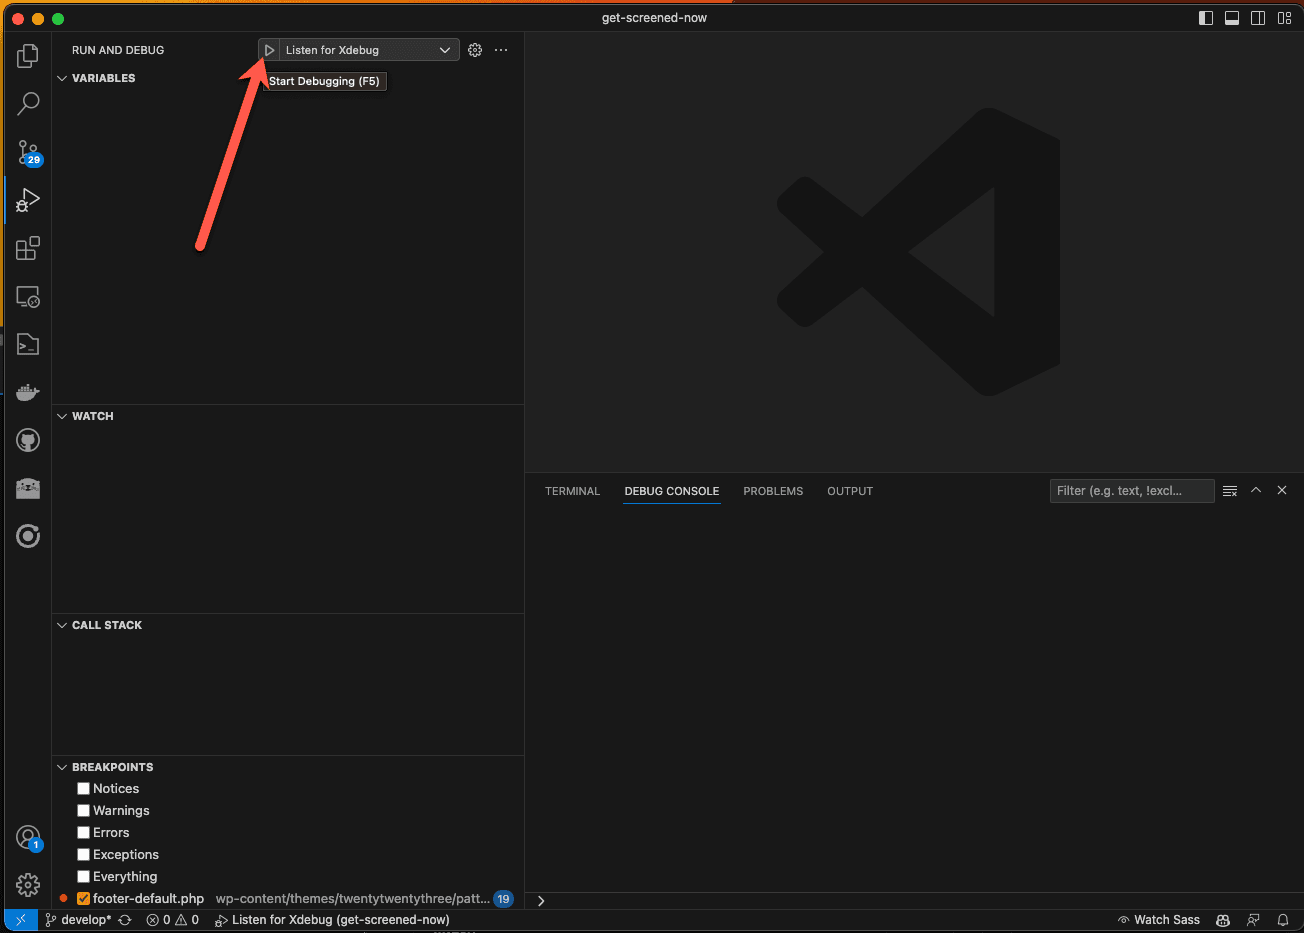
- Click the “Run and Debug” nav item in VSCode
- Click the top “Play” button. (This should not be visible after we setup the launch.json file)
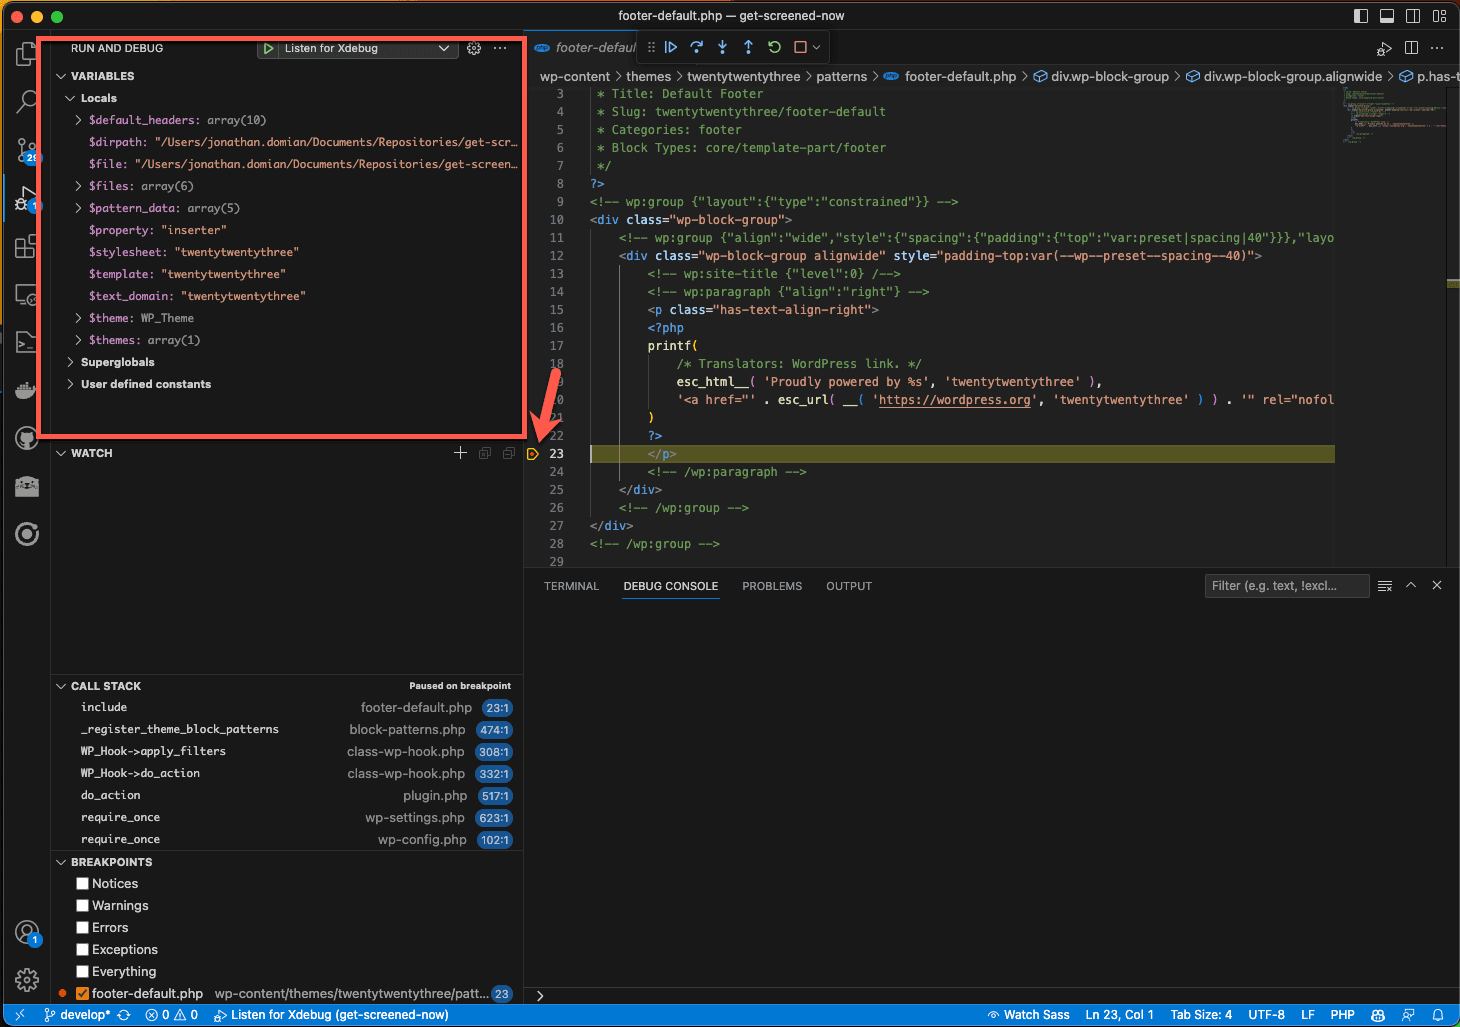
- After clicking “Play,” return to your “Folder” listing or “Directory” listing in VSCode and select a PHP file. Click to the left of any line in the file to toggle breakpoint. You should also notice the “Step Through” controls are now visible at the top.

- Refresh your site, and your breakpoint should turn from a “RED DOT” to a “RED DOT SURROUNDED BY A YELLOW PENTAGON”. You should also be able to view live variables in the “Run and Debug” tab.
At this point, you should have a default site you can debug with Xdebug and VSCode.